Scrape metrics from universe nodes
Your independent Prometheus instance will scrape data from database nodes directly (in the case of VM-based universes) or scrape data from a Kubernetes Prometheus Operator Service Monitor (in the case of K8s-based universes). This data scraping runs in parallel to and independently from the YugabyteDB Anywhere-embedded Prometheus.
Every node of a YugabyteDB universe exports granular time series metrics. The metrics are formatted in both Prometheus exposition format or JSON for seamless integration with Prometheus.
Prometheus format
View YB-TServer metrics in Prometheus format in the browser or via the CLI using the following command:
curl <node IP>:9000/prometheus-metrics
View YB-Master server metrics in Prometheus format in the browser or via the CLI using the following command:
curl <node IP>:7000/prometheus-metrics
JSON format
The YugabyteDB Anywhere API can expose the health check results as a JSON blob. You can view YB-TServer metrics in JSON format in the browser or via the CLI using the following command:
curl <node IP>:9000/metrics
Using this API to retrieve health check alerts would require you to first parse the JSON, and then do some text parsing afterward to scrape the metrics from each field.
The Prometheus Operator should be installed on your Kubernetes universe. To verify that it is running, use the following command:
kubectl get pods -n kube-prometheus-stack kube-prometheus-stack-operator-5577f9747-hqzbw
NAME                                             READY   STATUS    RESTARTS   AGE
kube-prometheus-stack-operator-5577f9747-hqzbw   1/1     Running   0          4d19h
To use a custom Prometheus instance with a universe on Kubernetes:
-
In YugabyteDB Anywhere, navigate to the universe you want to monitor.
-
Click Actions and choose Edit Kubernetes Overrides.
-
Add the following configuration:
serviceMonitor:
  enabled: true
  extraLabels:
    release: prom
This enables a service monitor and adds an extra label
release: prom, which is required by the Prometheus Operator to discover the service monitor. -
Click Upgrade.
To verify the configuration:
-
Access your Prometheus dashboard.
-
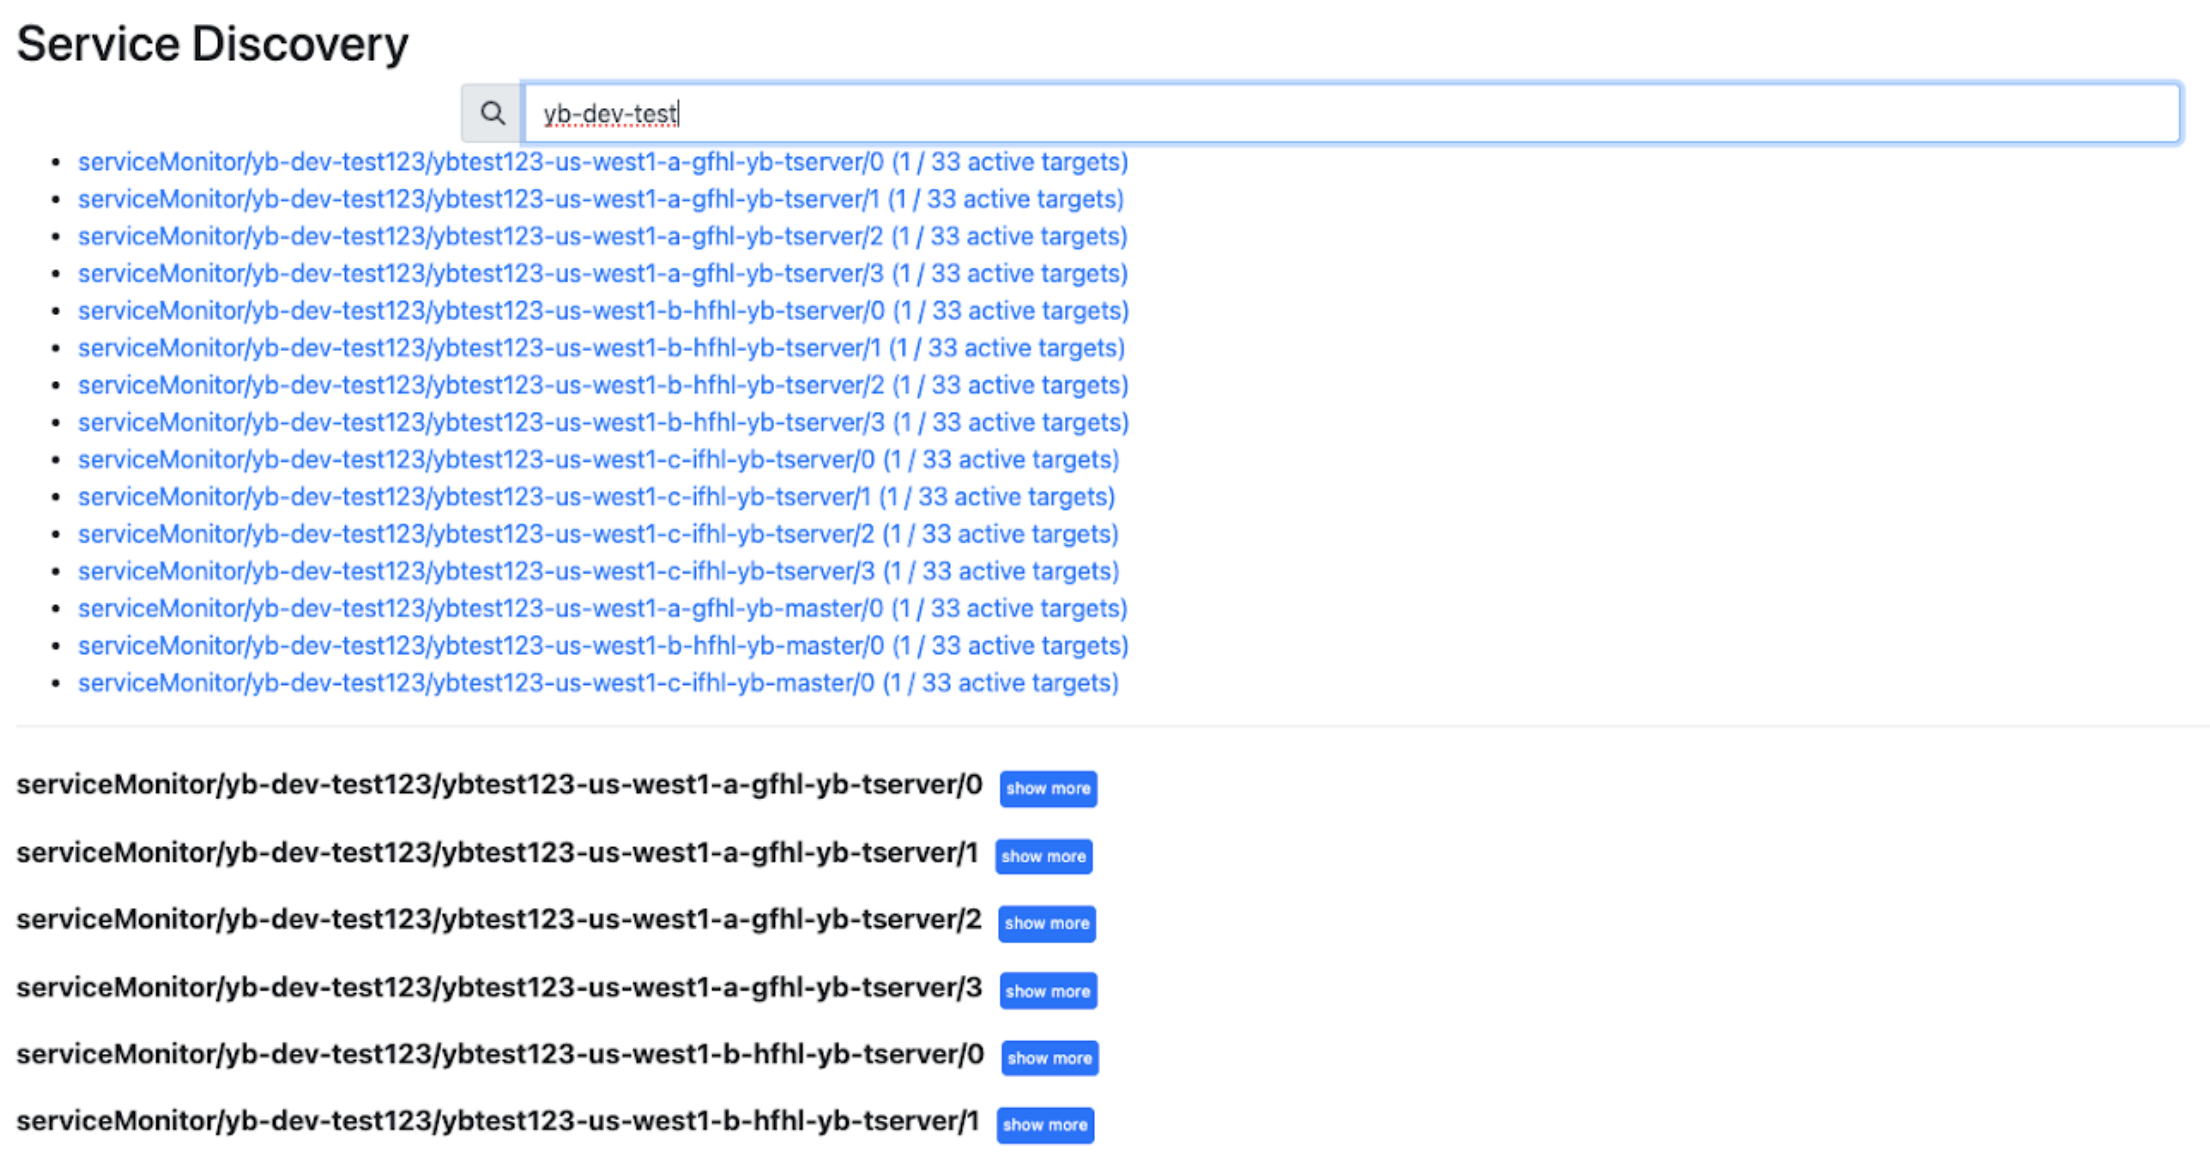
Navigate to the Service Discovery page and search for the name of your universe.
The service monitor for your YugabyteDB Anywhere universe should be listed.

To view metrics, use Prometheus queries. For sample queries, refer to Analyze key metrics.